Jan 24,2025
The Ministry of Ecology and Environment announced the national ambient air quality status for December 2024 and January–December 2024 to the media today.
Air Quality
General Situation
- In December, the average concentration of PM2.5 in 339 cities at or above the prefecture level across the country was 43.1 micrograms per cubic meter, a year-on-year decrease of 6.3%; the average concentration of PM10 was 66 micrograms per cubic meter, down 7.0% year-on-year; the average concentration of O3 was 85 micrograms per cubic meter, up 3.7% year-on-year; the average concentration of SO2 was 9 micrograms per cubic meter, down 10.0% year-on-year; the average concentration of NO2 was 31 micrograms per cubic meter, down 3.1% year-on-year; and the average concentration of CO was 1.0 milligrams per cubic meter, down 23.1% year-on-year.
- In December, the proportion of days with good or excellent air quality in the 339 cities at or above the prefecture level was 88.0%, up 6.0 percentage points year-on-year; the proportion of days with severe or above pollution was 0.2%, down 3.1 percentage points year-on-year. The proportion of days exceeding standards due to dust storms was 0.3%, with no days of severe or above pollution.
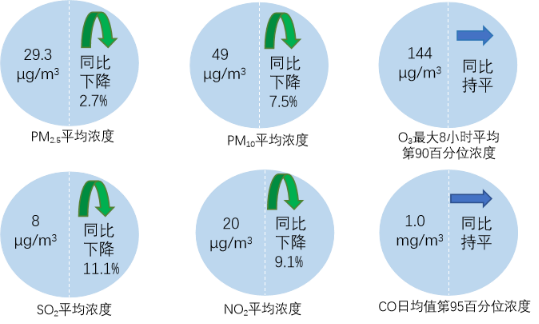
- From January to December, the average concentration of PM2.5 in the 339 cities at or above the prefecture level was 29.3 micrograms per cubic meter, down 2.7% year-on-year; the average concentration of PM10 was 49 micrograms per cubic meter, down 7.5% year-on-year; the average concentration of O3 was 144 micrograms per cubic meter, unchanged year-on-year; the average concentration of SO2 was 8 micrograms per cubic meter, down 11.1% year-on-year; the average concentration of NO2 was 20 micrograms per cubic meter, down 9.1% year-on-year; and the average concentration of CO was 1.0 milligrams per cubic meter, unchanged year-on-year.
- From January to December, the proportion of days with good or excellent air quality in the 339 cities at or above the prefecture level was 87.2%, up 1.7 percentage points year-on-year; the proportion of days with severe or above pollution was 0.9%, down 0.7 percentage points year-on-year. The proportion of days exceeding standards due to dust storms was 1.9%, with 0.4% of days experiencing severe or above pollution.
Figure 1: Proportion of Days at Different Air Quality Levels in 339 Cities at or Above the Prefecture Level in China from January to December 2024
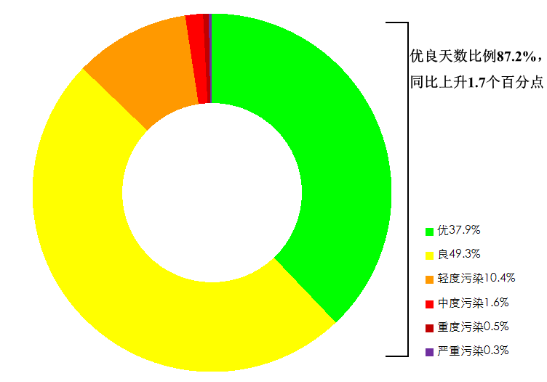
Figure 2: Concentrations and Year-on-Year Changes of Six Key Air Quality Indicators in 339 Cities at or Above the Prefecture Level in China from January to December 2024
Source:https://www.mee.gov.cn/ywdt/xwfb/202501/t20250124_1101318.shtml


Never miss an update from us. Sign up for our newsletter and stay informed about our latest news, products, and promotions.
2014-2024 © Copyright Charmission, All rights reserved.京ICP备19015279号-2